Apple scab (Venturia Inaequalis) Model
Apple scab is the most common, and perhaps, therefore, the important, disease in apple orchards and is caused by the fungal pathogen Venturia inaequalis (asexual stage: Spilocaea pomi), which causes leaf and fruit spots.
The video with detailed explanations about this model is available here
The fungus overwinters as perithecia in dead apple leaves accumulated on the ground. In the spring, ascospores (primary inoculum) are released from the perithecia after it has rained. Apple trees are susceptible to the disease starting from the green tip stage (C-C3).
It is essential to properly manage the primary season to limit the number of treatments needed during the summer. RIMpro, therefore, offers several distinct modules:
- Primary infections
- Secondary infections
- Spot tracer
- Fungicide management
In order to get a realistic simulation, you first need to set your biofix in local parameters. The biofix is determined by the first dischargeable ascospores or the green tip date for your main variety. Depending on the year, you should set your biofix to whatever occurs first.
Primary infections

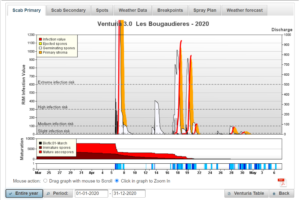
In the bar below the graph, the light blue data represents the wetness of the leaves based on factors such as rainfall in your area, leaf wetness, and relative humidity values. The dark blue data corresponds to the hours of active precipitation.
The middle graph indicates the maturating process of perithecia in leaf litter, which is determined by temperature and humidity conditions. The brown data corresponds to spores that are not yet mature and cannot yet be ejected in the next rain event. The red corresponds to the spores that can be ejected during the next rain.
The upper graph simulates the infection process. The yellow bars correspond to the spore discharge every 30 minutes depending on the stock of mature spores, rain, temperature, and light conditions. The germinating spores on the leaves are modelled in white on the graph. These germinating spores are still sensitive to contact fungicides. The red line is the (relative) number of spores that have successfully infected the leaf. The higher the red curve, the more severe the scab contamination.
The orange field is the period during which the fungus has only developed its primary stroma in the leaf. At this stage, the infection can still be stopped by curative products such as dodine, lime sulfur, or bicarbonate. From the moment the orange field decreases, the first spores have grown deeper into the leaf, and the infection process can only be stopped by strong curative products.
Interpret the data
In Europe, infection values for which the RIM is less than 100 are considered mild, between 100 and 300 moderate, and greater than 300 as serious infectious events. In our model, the RIM value is the red line in the graph as read on the left axis of the main graph. In the United States, apple scab appears to be less aggressive. The general rule of thumb is that if your orchard is relatively clean (no scab damage the previous year), then RIM infection values below 300 are probably not worth dealing with. However, if you have a high scab inoculum, you should also deal with the low-risk factors.
NOTE: The RIM values shown on the graph to the right of the blue line are based on the weather forecast and will change whenever the weather forecast changes. A major infection that is still 4 days in the future may well go away before that day because the weather forecast has changed. So, remember to regularly check the forecasts.
Secondary infections
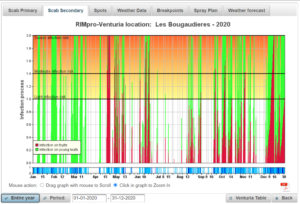
This graph shows the periods at risk for leaf and fruit contamination by conidia. These conidia are disseminated by rain splashes on sporulating spots. Young fruits are very susceptible to scab infections, but their sensitivity decreases with age.

On this graph, we find the periods of rain and wetness in the lower part. The central graph indicates the periods of infections on fruits (in red) and on young leaves (in green).
Spots
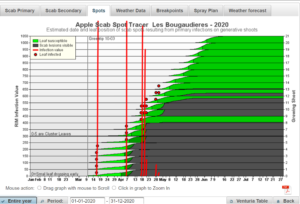
The “scab spots” is a graph that shows you when and on what estimated leaf-level scab symptoms become visible. This helps you with scab management in two ways:
- Forwards: When you missed an infection, when and on what leaf-level should you expect scab lesions?
- Backwards: When you see scab lesions appearing in the orchard on a certain leaf level, from which infection event do these lesions originate?

On the left axis, you can find the RIM values of the primary infections, but you can also find the leaf numbers. Number 1 being the first leaf of the season to unfold. Number 0 to 5 are cluster leaves, and other numbers indicate shoot leaves.
When a red dot appears, it means that this leaf was infected by the infection on that date. If the leaf was susceptible and infected, the incubation process starts, and the model predicts when symptoms become visible (in grey on the graph).
Treatments
The secret to effective scab control is the ability to adjust the timing and choice of fungicide as the infection develops.
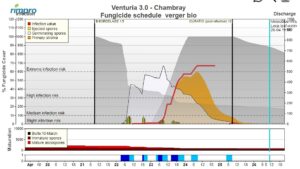
RIMpro helps you by showing the development of the infection in real-time, estimating the coverage remaining from your previous fungicide application, as well as the curativeness of some fungicides.
RIMPRO calculates the decrease in fungicide coverage from leaf growth and rainfall since the application of the treatment. The curative period of fungicides depends on the temperature in the hours preceding the treatment. Each fungicide has its own properties.

Both growers with an independent RIMpro account as well as growers with an account as “guest of an advisory service” can use this service. This feature is only used to get an idea of how effective your spray program is. Spray records can only be viewed, edited, and deleted by the grower.
On this graph, we can see the fungicidal coverage of preventive treatments (towards right) in grey decrease depending on the weather and the growth of the plant. For curative treatments (towards left) in grey, the duration of the curative period depends on the temperature in the hours preceding the treatment.
The preventive fungicidal action must cover the period of the targeted ejections (yellow sticks). The grey zone must therefore extend above the spores to be killed. The post-infection fungicidal action must cover retroactively at least to the beginning of the red line of the targeted infection.
Results interpretation
Here are some basic rules for interpreting results and planning your next treatments:
- The overall risk of scab depends on the inoculum pressure (= level of scab infection the previous year) and the sensitivity of the apple variety.
- When there are high and extreme potential risks, fungicide treatments alone are not effective enough. The inoculum should be reduced before the season with sanitation measures.
- Scab infections with RIM values greater than 600 are rare and extremely dangerous. During these infectious events, two treatments are always necessary to be sure that all the spores are affected: a preventive treatment shortly before the rain and a curative treatment during the germination window.
- Contact fungicides like Dithianon and Captan are active during spore germination. If the last treatment was several days before infection, only the fraction of the fungicide remaining between rain and infection is the effective dose.
- Treatments during the germination window are most effective. In fact, in this case, the applied dose is the active dose.
- To be effective (depending on the situation), at least 30-50% of the fungicide must still be present during the germination window.
- Due to the emergence of scab resistance to systemic fungicides, scab control strategies should primarily be based on the effective application of contact fungicides. Systemic fungicides should be considered as a last resort.
Get in touch
You can set up your account and your stations yourself online on our website. Do you have any questions, or do you need assistance? Please contact us.