 Log in
Pear Brown Spot (Stemphylium vesicarium) Model
Stemphylium vesicarium infects the leaves and fruits of pear trees. The fungus has a wide host range and is therefore not specific to pear trees.
The variety, vigour, and condition (state of stress) of the tree influences its sensitivity to the Pear Brown Spot disease. Local soil conditions also appear to be an important but poorly understood factor in the local occurrence of the disease.
The control of this disease with chemical fungicides is only partially effective. Although it is possible to reduce the number of sprays by correctly timing your fungicides application to infection events, it, unfortunately, does not improve the effectiveness of the control over the disease.
The Model
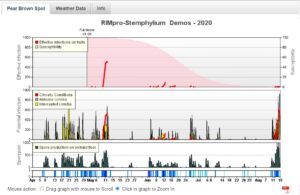
In the bar below the graph, dark blue represents the periods when your weather station recorded rain. Light blue is the period when there is wetness on the leaves. This is calculated based on your records of rain, relative humidity, and leaf wetness.
The lower graph simulates the production of spores on the ground. Conidiospores are produced in leaves, grass, and other decaying organic debris on the orchard floor. The model assumes a constant population of Stemphylium vesicarium present on the orchard floor during the growing season.
This population of Stemphylium produces conidiospores overnight, as long as humidity conditions are favourable. The rain and the humidity of the leaves allow the formation of spores.
The middle graph simulates the presence of spores in the air (in grey), spores on fruits (in yellow), and potential infections (in red) based only on the weather. The conidiospores are released during the day. These spores constitute the population of “airborne spores” until they are deposited on leaves or fruit or until they are expelled from the orchard. The interception of spores by pear trees relates to the concentration of spores in the air of the orchard. The spores accumulate on the fruit but are only viable for a short time when the surface of the fruit skin is dry.
The upper graph combines potential infection data with fruit sensitivity. The pear sensitivity decreases with the age of the fruits, which is also known as ontogenetic resistance. The fruits are the most sensitive during the first weeks after flowering, even if most symptoms become visible at maturity during the last month before harvest. The model considers that 80% of fruit infections occur within eight weeks after full bloom.
Potential infections based on meteorological data (middle graph) are multiplied by the susceptibility of fruit at this stage of development to indicate the actual risk of fruit infections. Most symptoms become visible in the last few weeks before harvest, but the disease does not increase further during cold storage.
The time between infection and the expression of symptoms is very variable due to different factors such as variety, stress, age of fruits, etc. and is therefore not modelled.