 Log in
Leaf wetness (for virtual stations)
The Model
The presence of free water on the surface of a crop canopy is defined as leaf wetness (Rowlandson et al., 2015). As leaf wetness duration (LWD) is an essential factor for infection of apple leaves, apple scab models are dependent on the LWD parameter (Stensvand et al. 1997; Leca et al. 2015).
It is often challenging to measure leaf wetness as there are a variety of different sensors which lack reliable standards. Ehlert et al. (2019) showed that several commonly used leaf wetness sensors in Germany did not accurately reflect apple scab infections that occurred during the study period.
Angle, orientation and canopy position are other non-standardised factors that influence the readings of a leaf wetness sensor (Rowlandson et al. 2015). Calibration and maintenance of the sensors are crucial for reliable LWD data.
RIMpro provides users with the option of using virtual stations based on weather data from Meteoblue. The meteorological data obtained for the virtual weather stations contain information for parameters such as temperature, air humidity and rain but not for LWD. This means that LWD has to be calculated from the other weather parameters (Trapman 2017). RIMpro uses a model which simulates the wetting and drying of apple leaves developed by Leca et al. (2015).
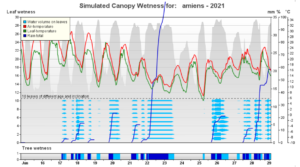
It was validated on a large scale in 2016 by asking the RIMpro users each time they used RIMpro whether apple trees were wet or dry at that moment (Trapman 2017). For 74 locations in central Europe, each observation was made by the grower as compared to the wetness indicated by the weather station and the virtual leaf wetness. In 81% of the cases, the observation made by the grower agreed with the in-orchard weather station, while the virtual leaf wetness was correct in 73% of the cases. The main discrepancy was that virtual data returned “false wets” in comparison with orchard observations.
For 35 locations, all primary infections were then compared using both the in-orchard station and virtual data. For the 417 potential infection events that occurred, 88% were calculated by both data types. In contrast, 9% of the infection events were calculated only on the orchard station data and 3% only on virtual data. In 65% of the infection events, the severity class of the infection was the same between the two types of stations.
Zandelin, Philip, 2021. Virtual weather data for apple scab monitoring and management. Second cycle, A2E. Alnarp: SLU, Department of Plant Protection Biology.