 Log in
Fireblight (Erwinia) model
In affected areas, primary Fireblight infections may occur during flowering on apple and pear trees. Years of a high incidence of Fireblight are associated with relatively high temperatures before flowering.
The video with detailed explanations about this model is available here
Favourable temperatures increase the fire blight population on host and non-host plants in the environment, and in bacterial cankers in the orchard. This leads to potentially higher inoculum levels for flower contamination. So far, we have no data to quantify this effect. For this reason, the effects of climatic conditions before flowering are not yet taken into account in the calculations.
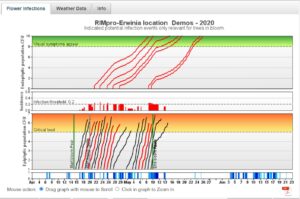 We find in the bottom graph the date, the periods of rain (in dark blue) as well as the periods of wetness (in light blue).
The lower graph models the risk of infection of flowers that open each day during flowering. Each open flower can be contaminated when the temperature is favourable for pollinators. The black lines model the epiphytic growth of bacteria on the surface of the stigmas for each new open flower.
When the bacteria population has reached a critical level and the flowers are wet from rain or dew, then infection may occur (red lines).
The middle graph models calyx infection. Water allows the movement of bacteria from the stigma to the hypanthus. The effectiveness of the infection increases with the concentration of bacteria and decreases with the age of the flower. After the petals fall, the flowers are no longer sensitive.
In the top graph, following hypanthus infection, the bacteria population increases and increases the internal pressure on the tissues until they burst and exudate comes out. From this moment, the symptoms become visible (when the red line crosses the green zone)
CAUTION: It is essential to fill in the start and end date of flowering because the bacteria only infect open flowers, and the susceptibility of the stigma decreases as the flower ages.